Climate Vulnerability Index

Based on the peer-reviewed journal article, Characterizing vulnerabilities to climate change across the United States, a dashboard and an interactive map of the U.S. designed by Darkhorse Analytics, the CVI allows users to search by location and view their overall climate vulnerability and the conditions that shape it – from quality of housing and access to supermarkets to proximity to toxic waste sites and number of deaths from air pollution. For example, census tracts in Houston’s Settegast community rank in the 99th percentile for overall vulnerability. The CVI shows what is driving vulnerability, including low chronic disease prevention, high exposure to harmful pollutants like soot and inadequate access to fresh, nutritious food.

Pulling in 184 sets of data to rank more than 70,000 U.S. Census tracts, the U.S. Climate Vulnerability Index helps users see which communities face the greatest challenges from the impacts of a changing climate. This tool shows what factors are driving the challenges, so policymakers and communities themselves can take action to build climate resilience where it is needed most.

You can interact with the map by:

  • Searching for a location
  • Zooming and panning across different areas
  • Clicking on a location for more details
  • Adjusting the map scale filter to focus on higher vulnerability locations

Searching for Energy, the CVI map shows the sources, availability, and affodability of energy in every U.S. census tract. Zooming in on the Chicago area, for example, shows that some census tracts, such as South Side, are ranked as having the “highest vulnerability” rating, in the 95-99 percentile compared with other locations across the country. Other locations in Chicago are much less vulnerable, ranking as low as 18th percentile in terms of energy vulnerabiilty.

34 states have climate equity policies in place as of 2023
Blog

EDF’s new equity map shows state efforts to make the energy transition fairer for all

Across the U.S. states are passing laws that will ensure greater equity as we transition to a clean energy system. EDF has developed an interactive map – based on our new report, the State Climate Equity Survey – that documents states’ efforts to make their energy transition more equitable and healthier. Our new map identifies which states require, allow, or promote consideration of equity and environmental justice in agency decision-making and budget-setting.
Media Article

Peoples Gas seeks record-high gas bill increase for customers

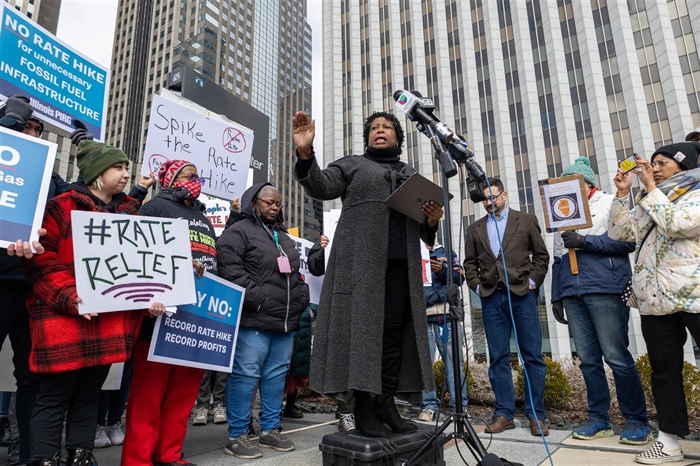
Environmental and community activists turned out in Chicago to protest against Peoples Gas' request for a $402 million rate hike for next year. "We don’t think consumers should be having to spend more money to rebuild fossil fuel pipelines," said activist Caroline Wooten. Dozens of activists showed up to Thursday's Illinois Commerce Commission meeting to make their final plea before the commission votes on November 16.
Utility rate case hero image
Press Release

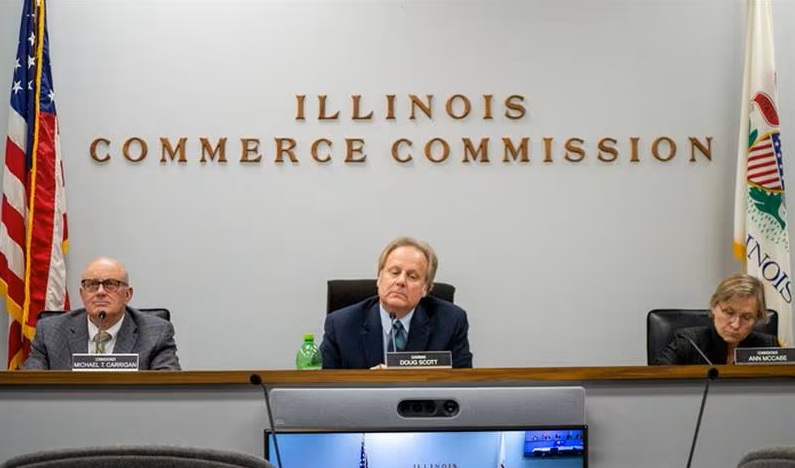
Illinois Commerce Commission Votes Will Help Ensure More Reliable, Affordable, Equitable Electric Service in the State

The Illinois Commerce Commission has taken steps that put Illinois on track for realizing the bold vision of the Climate and Equitable Jobs Act.
Pipeline running through agricultural area
Media Article

Legitimizing Situated Knowledge in Rural Communities Through Storytelling Around Gas Pipelines and Environmental Risk

A scholarly article from the November 2021 issue of Technical Communication, demonstrates that rural landowners and community members’ place-based knowledge is expertise that should be considered by technical communication professionals.